

TL;DR
- The all-in-one PCs in the shop show a rotating “ambient information” board whenever nobody is using them. On desks it is a screensaver driven by the compositor’s idle monitor. On the four dedicated wall panels it is the only thing on the screen.
- Much of what it shows is public context I wanted in my peripheral vision: local headlines, a markets digest, a radar frame, forecast, sky and space. The rest is queues from the business, which are not in this post and not in the screenshots.
- Headlines go through one small pure-Python module that filters, dedupes and assigns stable ids. The same file lives in two places and a test fails if the copies differ.
- A language model writes the sentences. It never supplies a number. Every figure on the markets scene is fetched, and anything the generator cannot join back to a real row is dropped.
- Six things broke. Four of them looked healthy from every dashboard I had. The only reliable check was to look at a real screen.
What it is
The shop has a set of Dell OptiPlex all-in-one PCs, 7760 and 7780 models, running Debian 13. As of this week the inventory says four of them are dedicated wall panels and five are desk machines. They were already on the network as workers in a small cluster, so a display job was an easy add.
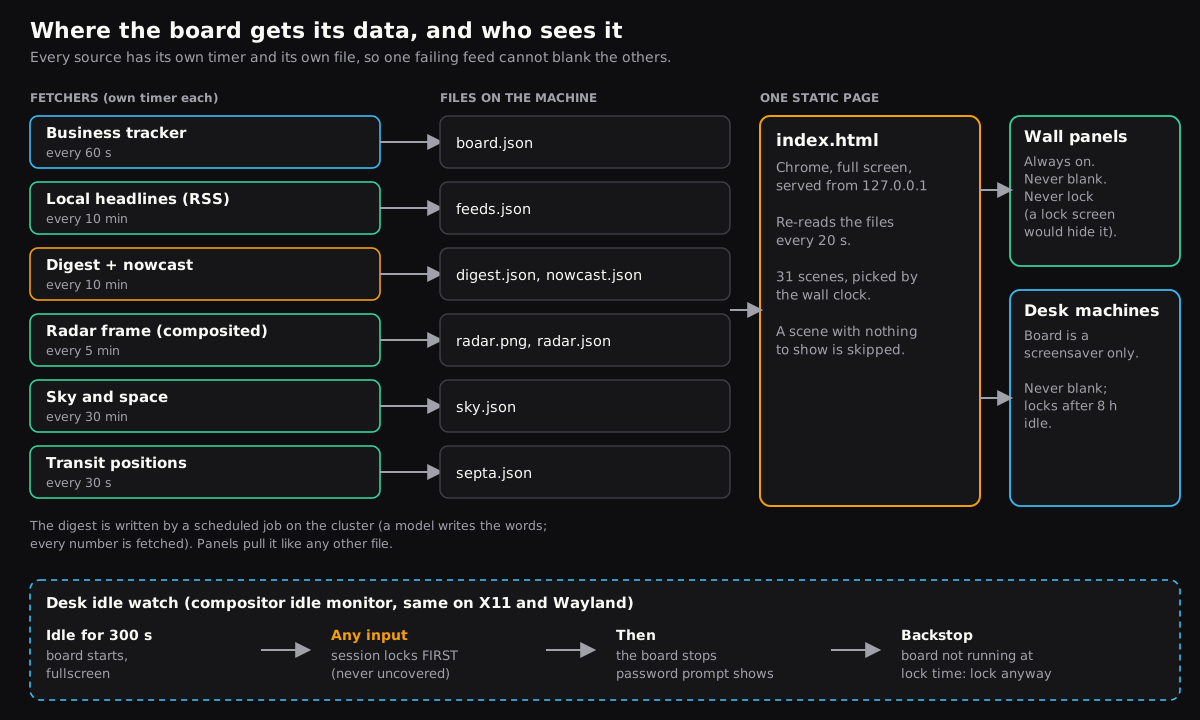
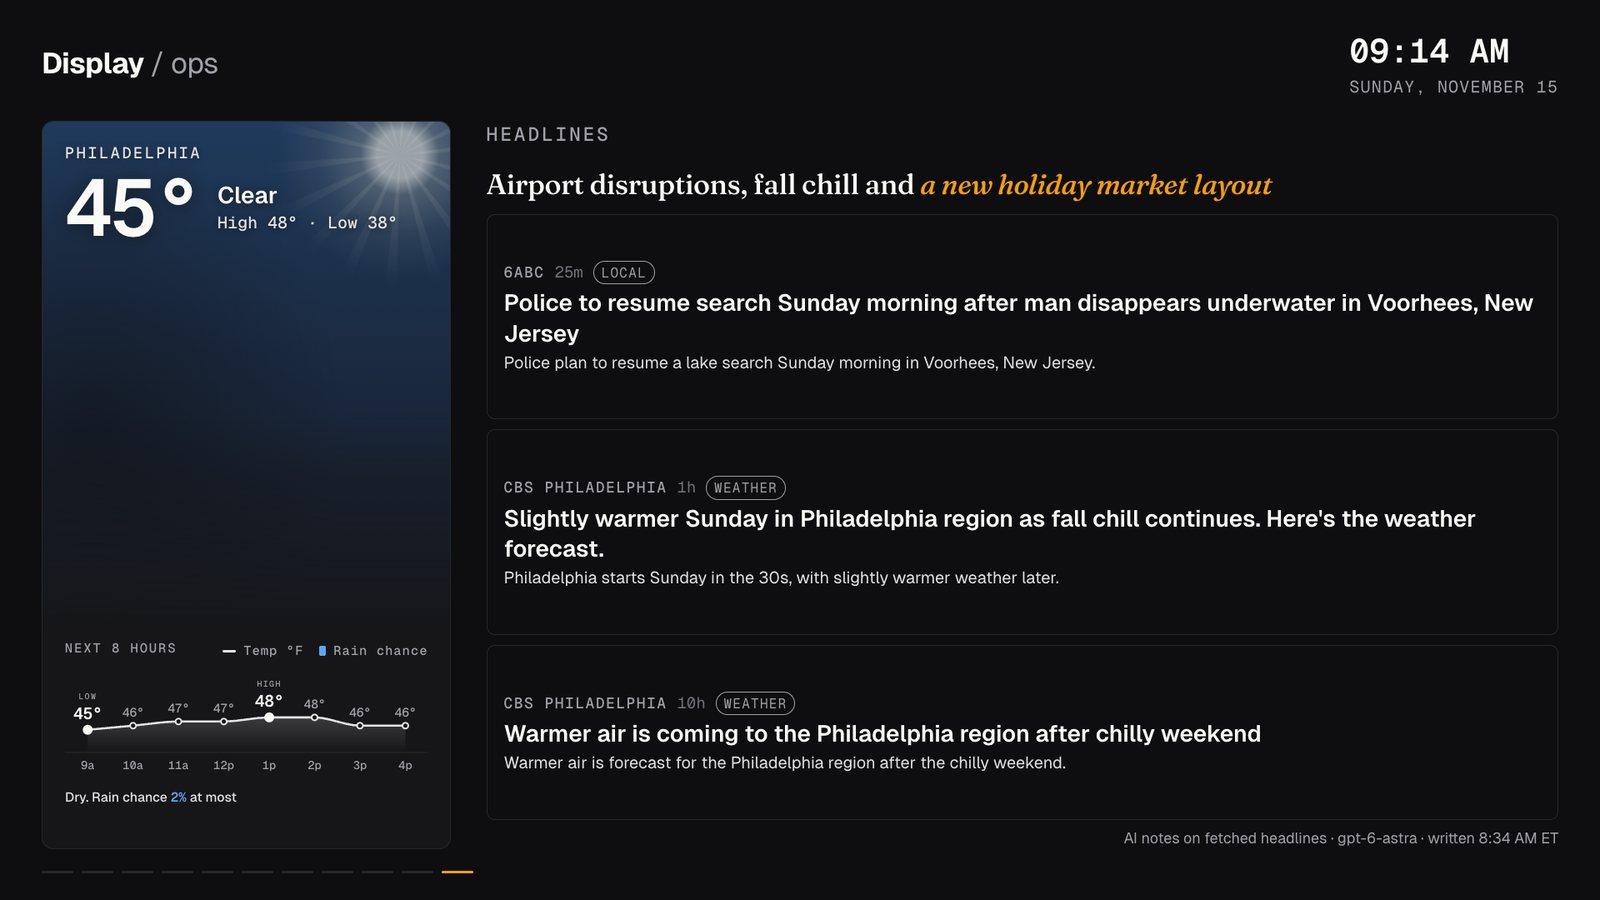
The display is a single static HTML page served from 127.0.0.1 on each machine and shown by Chrome in kiosk mode. There is no framework. Everything else is a handful of small fetch scripts that each write one JSON file next to the page. The header on the page reads “Display / ops”.
The page re-reads its JSON files every 20 seconds. The files themselves arrive on independent systemd --user timers:
| File | Source | Timer |
|---|---|---|
| board data | the business tracker | 60 s |
| headlines | public RSS feeds | 10 min |
| digest and nowcast | a job on the work cluster | 10 min |
| radar frame | public radar tiles, composited locally | 5 min |
| sky | ephemeris plus public space data | 30 min |
| transit positions | a live transit tracker I run | 30 s |
Separate files and separate timers are on purpose. A news outage cannot delay or corrupt the business queues, because they are different files with different failure modes. Each file is validated as JSON before it replaces the old one and written atomically. A truncated body keeps the last good copy, and the page judges staleness from each section’s own timestamp.
Idle watch: a screensaver that locks the desk
On a wall panel the board is the permanent foreground. On a desk that is exactly wrong. The board has to stay out of the way while someone works, appear when they walk off, and get out of the way again, behind a password prompt, the moment they come back.
The obvious tools are xprintidle or a real screensaver. I used neither. The fleet is mixed X11 and Wayland, and a desk can move between them. The one thing that sees every input event in both is the compositor, and Mutter exports org.gnome.Mutter.IdleMonitor in both session types. It has two calls that are exactly the pair I needed:
AddIdleWatch(ms)fires once when the session has been idle that long. On a desk that is 300 seconds, and the board starts as a fullscreen Chrome kiosk.AddUserActiveWatch()fires once on the next input after that.
Both are edge-triggered, so the watcher polls nothing and costs nothing while the desk is in use.
The order on wake-up matters. The watcher locks the session first and stops the board second. Stopping the kiosk first would uncover the unlocked desktop for as long as GNOME takes to raise the lock screen: a flash of whatever was open, and a real if tiny window for a walk-up. The lock screen draws above a fullscreen kiosk, so locking first means the desktop is never uncovered.
Since 2026-11-14 no machine blanks its screen. The wall panels do not lock at all, because a lock screen would replace the board. Desks lock after eight hours idle. GNOME cannot lock a session without blanking it, so with blanking off, this watcher is the only thing that locks a desk. That produced the one safety net I added: if the idle window passes and the board is not running (Chrome died, or never started), the watcher locks the desk anyway. Otherwise a crashed kiosk would leave an idle desk unlocked indefinitely.
Scene rotation without a leader
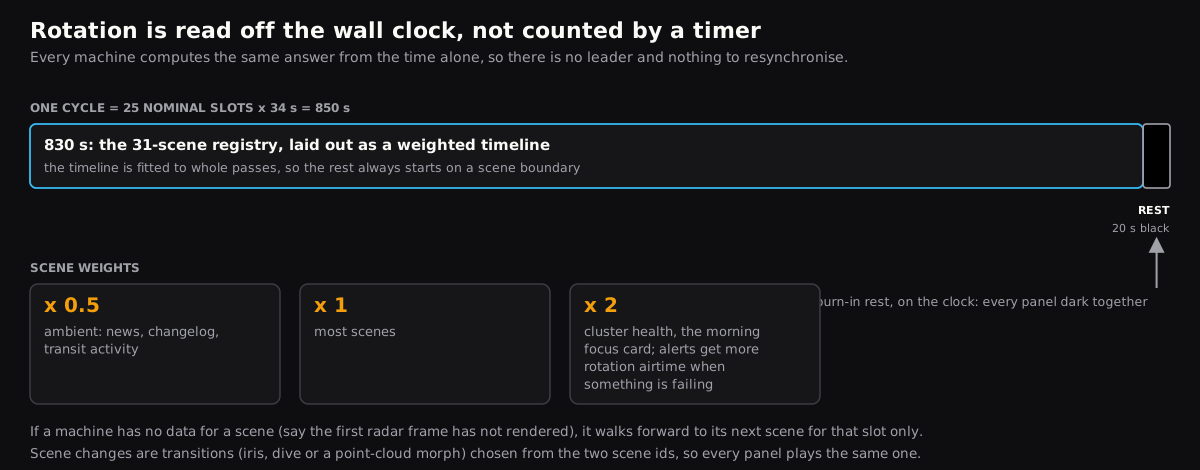
The registry has 31 scenes. Each has an id, a builder function and a weight. A builder that has nothing to show returns null and the scene is simply skipped on that machine. Half-weight scenes are the ambient ones, like news and the changelog. The cluster scene gets double.
Early on, every panel advanced with a setInterval that started when its own Chrome started. The wall looked like a row of unsynchronised clocks, which is exactly what it was. My first guess was clock drift, so I measured it: all eight units reported synchronised time and agreed to about 30 ms. Time was never the problem. Phase was. Any crash, restart or redeploy put that panel out of step for good.
The fix was to make the current scene a pure function of the wall clock. The page lays out a weighted timeline over the whole registry, with a nominal slot of 34 seconds for a weight-1 scene, and indexes into it with Date.now(). The timeline is fitted to whole passes through the registry, so real dwell shifts a little with how many scenes a machine has. A machine that reboots at 3am rejoins the wall in step on its first frame, with no coordination and no leader. A machine missing a scene, say because the radar has not rendered yet, walks forward to its next one for that slot only.
Every 25 nominal slots the whole wall rests to black for 20 seconds. That is a cheap defence against burn-in, and it is also on the clock, so every panel goes dark and comes back together.
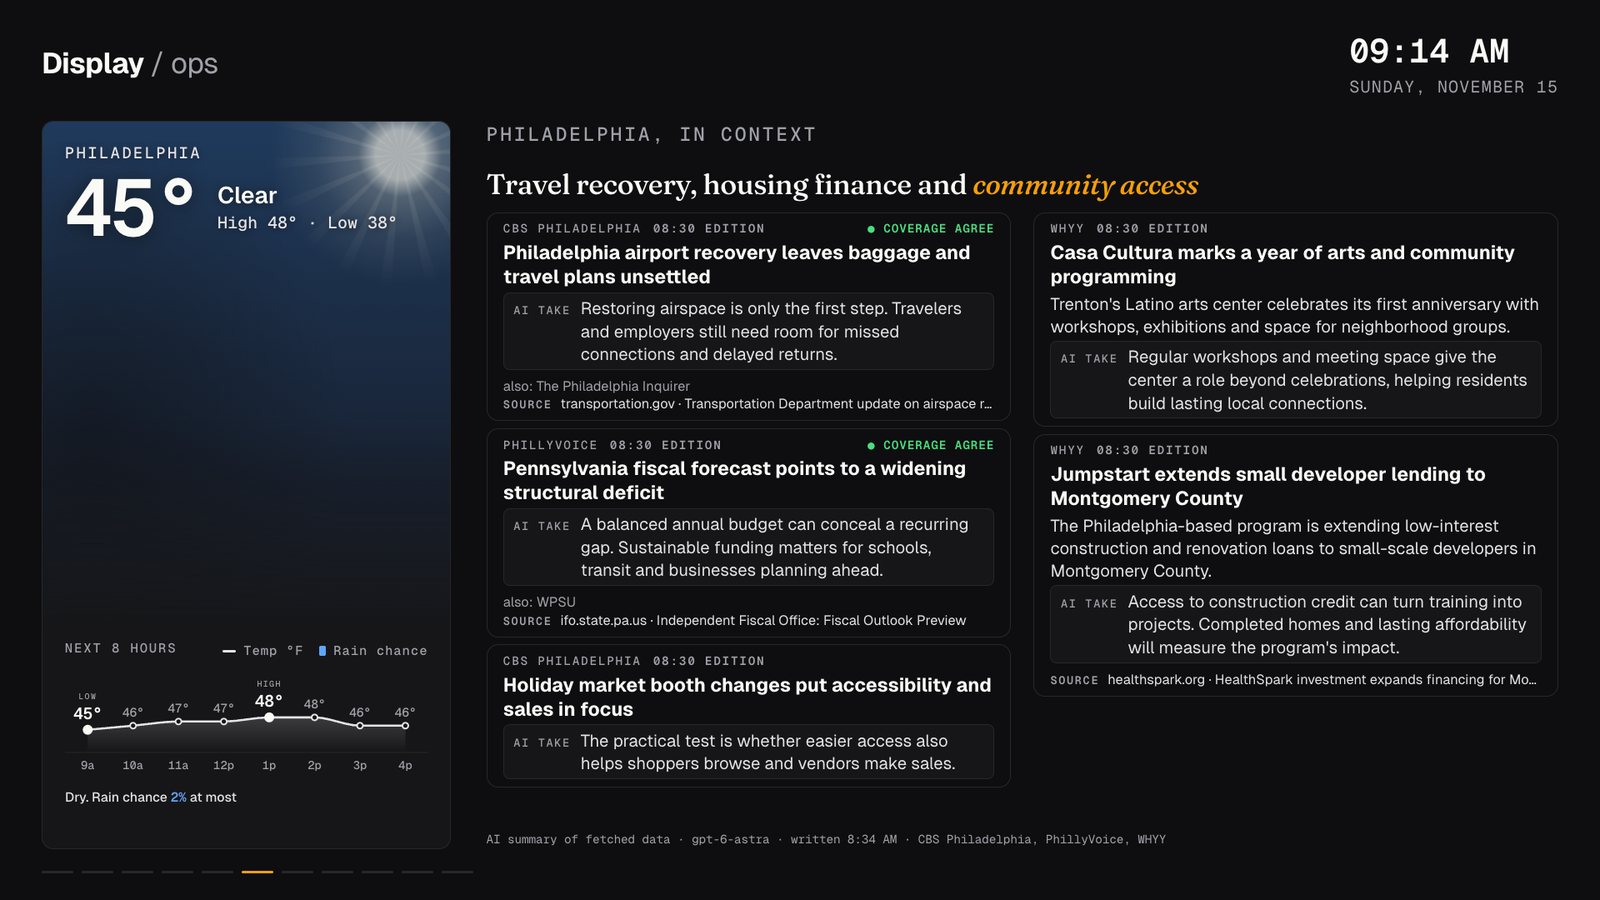
How headlines get fetched and deduped
The headlines scene reads rows from headlines_core.py. It is pure standard-library Python with no I/O: you hand it the raw feed bytes per outlet and the current time, and it returns rows and errors. There are three outlets: 6abc, CBS Philadelphia and Billy Penn. The rules, in the order they run:
- Age. A row older than 24 hours is dropped. Billy Penn gets 36, because it is hourly, hyperlocal and slow. A
pubDatemore than an hour in the future means a broken feed and the row goes too. NBC10 is not in the list at all, because every item in its feed carries one build-time date, so there is no usable age. - Junk. A regex on the title drops newsletters, giveaways, recipes, gift guides and horoscopes. I was careful about what is not in it. “Watch live”, “photos:” and “guide to” lead real breaking news and service news, so they stay.
- Locality. 6abc runs national wire copy next to its own reporting. A deny list matches national signals in the title or the feed’s category tags: Washington, the White House, any large city that is not ours, any US state that is not ours. A row that matches is hidden unless it also names the Philadelphia area. I picked a deny list over an allow list because a real local story in a neighbourhood nobody listed must never silently disappear.
- Second opinion. Even a national-looking 6abc row stays if at least three significant words overlap with a story from another outlet. Names are matched fuzzily, so “Allford” and “Alford” count as one.
- One id per story.
sha1(normalised url)[:10]. The normaliser lowercases the host and strips the query, fragment and trailing slash. When a feed has no usable link it falls back to the guid, then to a hash of the outlet and title. - Merge and dedup. Sort by recency, take at most three per outlet, and drop any title whose token Jaccard similarity to an already chosen one is 0.5 or higher. Up to 16 rows come out. If fewer than 8 survive, because an outlet is down or quiet, the per-outlet cap relaxes from 3 to 5.
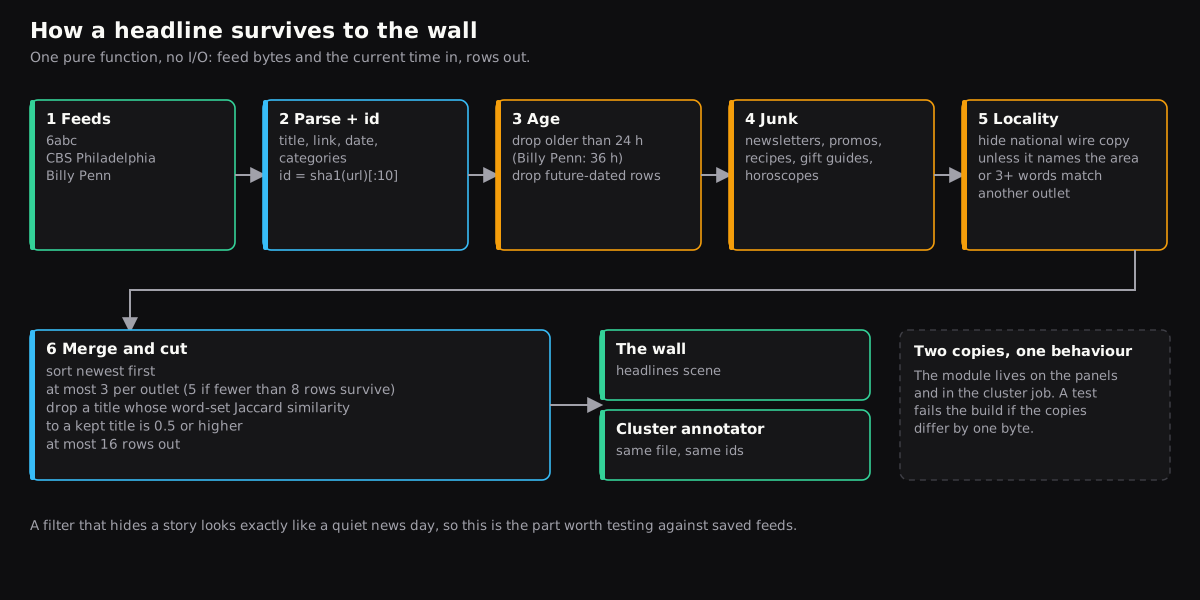
The file exists twice, once on the panels and once in the cluster job that annotates the headlines, and the two copies are required to be byte-for-byte identical. Kustomize cannot read across the repo, so the cluster copy is a copy, and a test fails the build if they ever differ. The ids are why that matters: the panel’s live rows and the generator’s notes pair up by id, and a drift in the hash rule would silently unpair them.
An early version of the cap did not actually bind at three, and the junk filter was too wide. Both were fixed the next day, 2026-11-10, with a wider locality allow-list for the Philadelphia area. Filtering is the part of this project I would test first if I did it again, because it fails quietly: a story that never appears looks exactly like a quiet news day.
Markets, with the numbers kept away from the model
The markets scene is the one visitors stop and read. Index levels, rates, Bitcoin and an AI-stock basket come from daily closes. A conditions summary, an “AI trade” box and a few research ideas sit under them.
I do not trust a model with arithmetic, so the split is strict. The numbers are fetched. The model returns text and item ids. The generator joins the ids back to real rows, clamps lengths, and drops anything it cannot verify, such as a news id it never fetched or an unknown area. The footer says “AI summary of fetched data” and “ideas to research, not advice”, and the scene carries a one-word tone tag. This one says NEUTRAL.
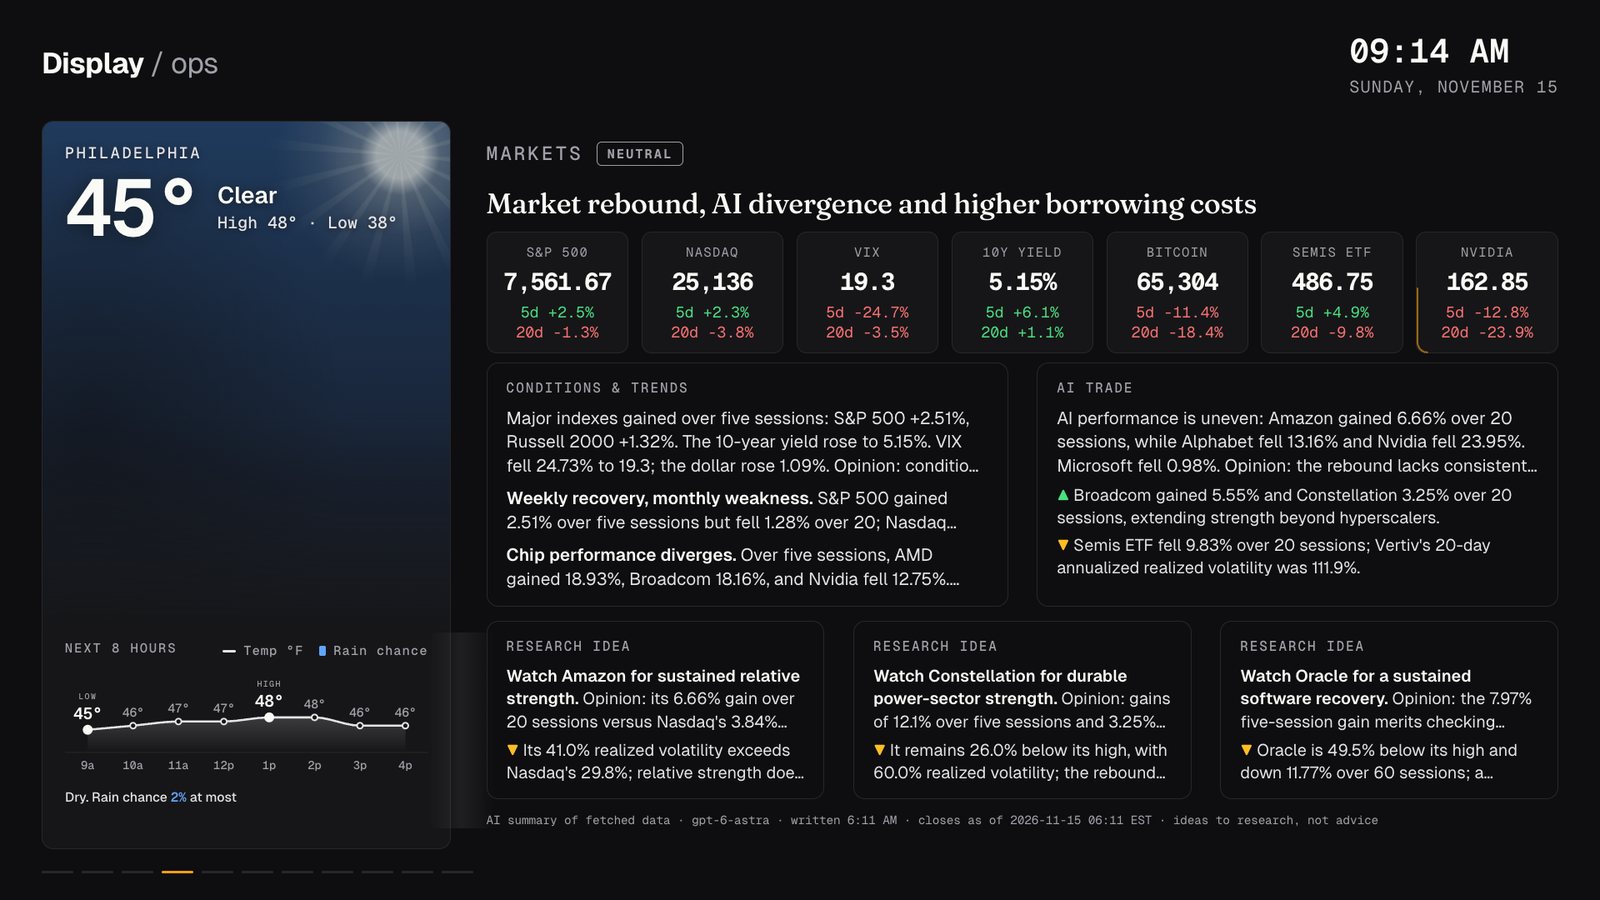
The text comes from a scheduled Codex job on the work cluster, 13 calls a day, six of them with live web search. The news runs five times a day and the markets at 06:10. Each job is one pod in three steps. The step that talks to a model and the open web has no secrets and no service account token. The steps that hold tokens never see the model. I did that because a hostile web page can steer a model into reading its own environment, so the answer is to not have anything there to read, instead of asking the model nicely.
Radar, rendered on the machine
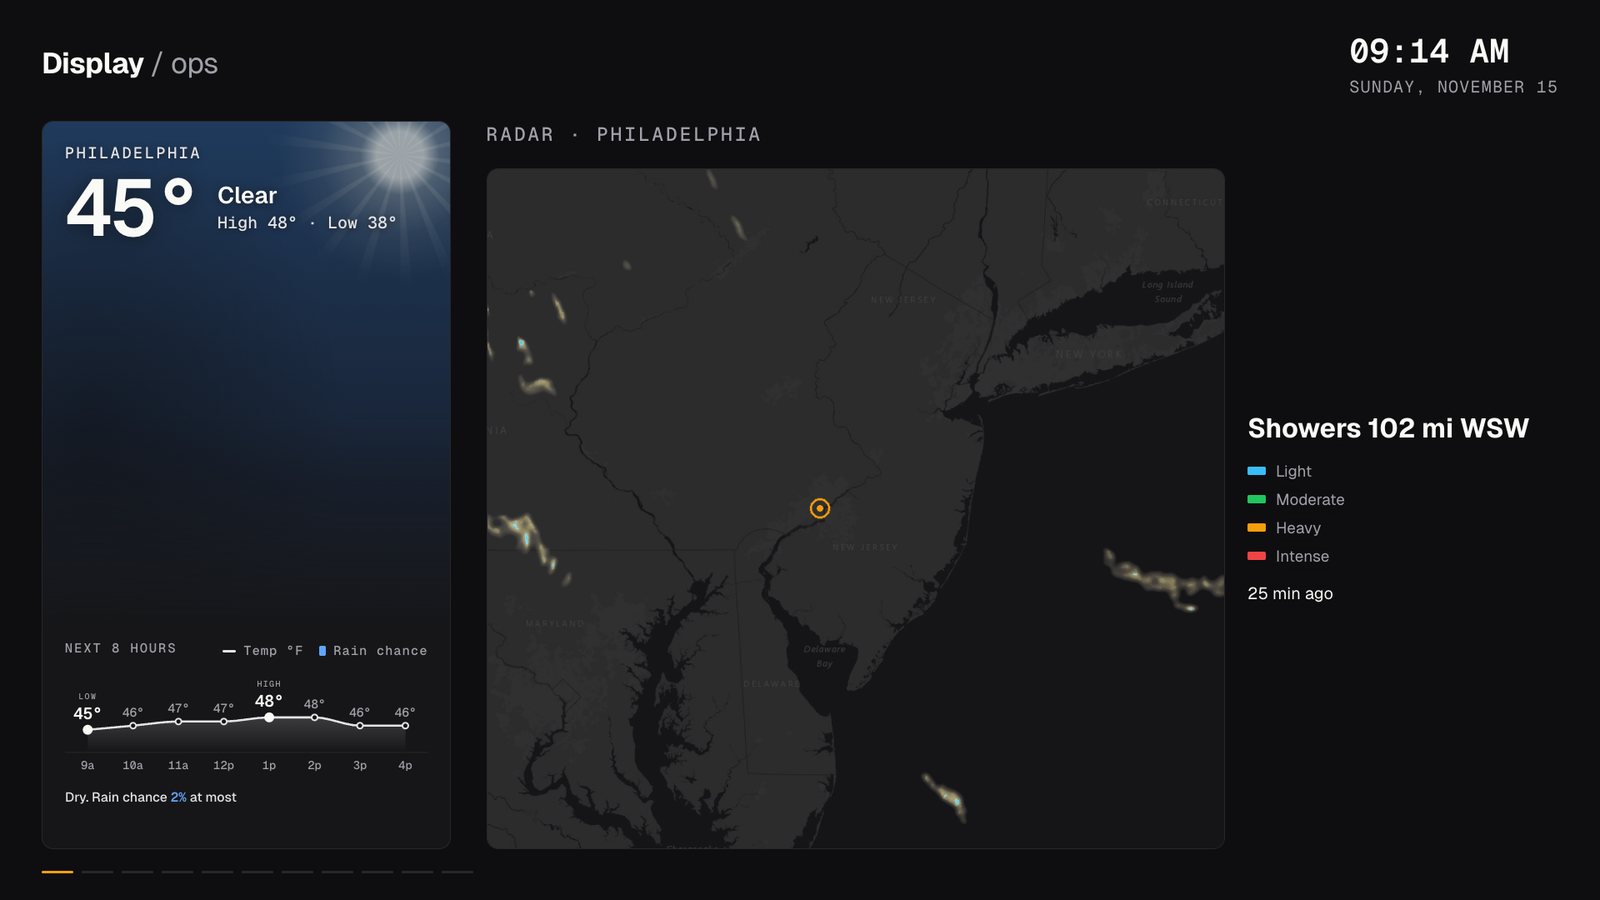
I did not want a slippy-map library in a kiosk that has to survive a bad network. So a script composites a PNG on each machine and the page shows a single <img>. It takes the newest past frame from the radar index, not a forecast frame, because the board says “radar” and a prediction under that label would be a quiet lie. The base map is dimmed to 0.62 brightness so the radar colours get the contrast. A small JSON file carries the frame time, and the page ages the picture out when it is stale. A stale radar is worse than none.
Three details came from getting it wrong:
- My first choice of basemap, CARTO’s keyless tiles, returned HTTP 200 and a valid PNG stamped with “Zoom Level Not Supported” and an API key watermark. The status code said it worked. Only looking at the pixels showed it did not. I switched to Esri’s dark gray base, which serves clean keyless tiles. Note that its path order is
z/y/x, y before x, unlike every other XYZ service. - The radar is drawn at 512 px and Esri serves 256 px tiles. Upscaling would blur every place name, so each radar block is backed by four tiles from one zoom level deeper.
- Coastlines do not move. The base is cached forever, so steady state is a few small radar tiles per refresh.
Where the orders went
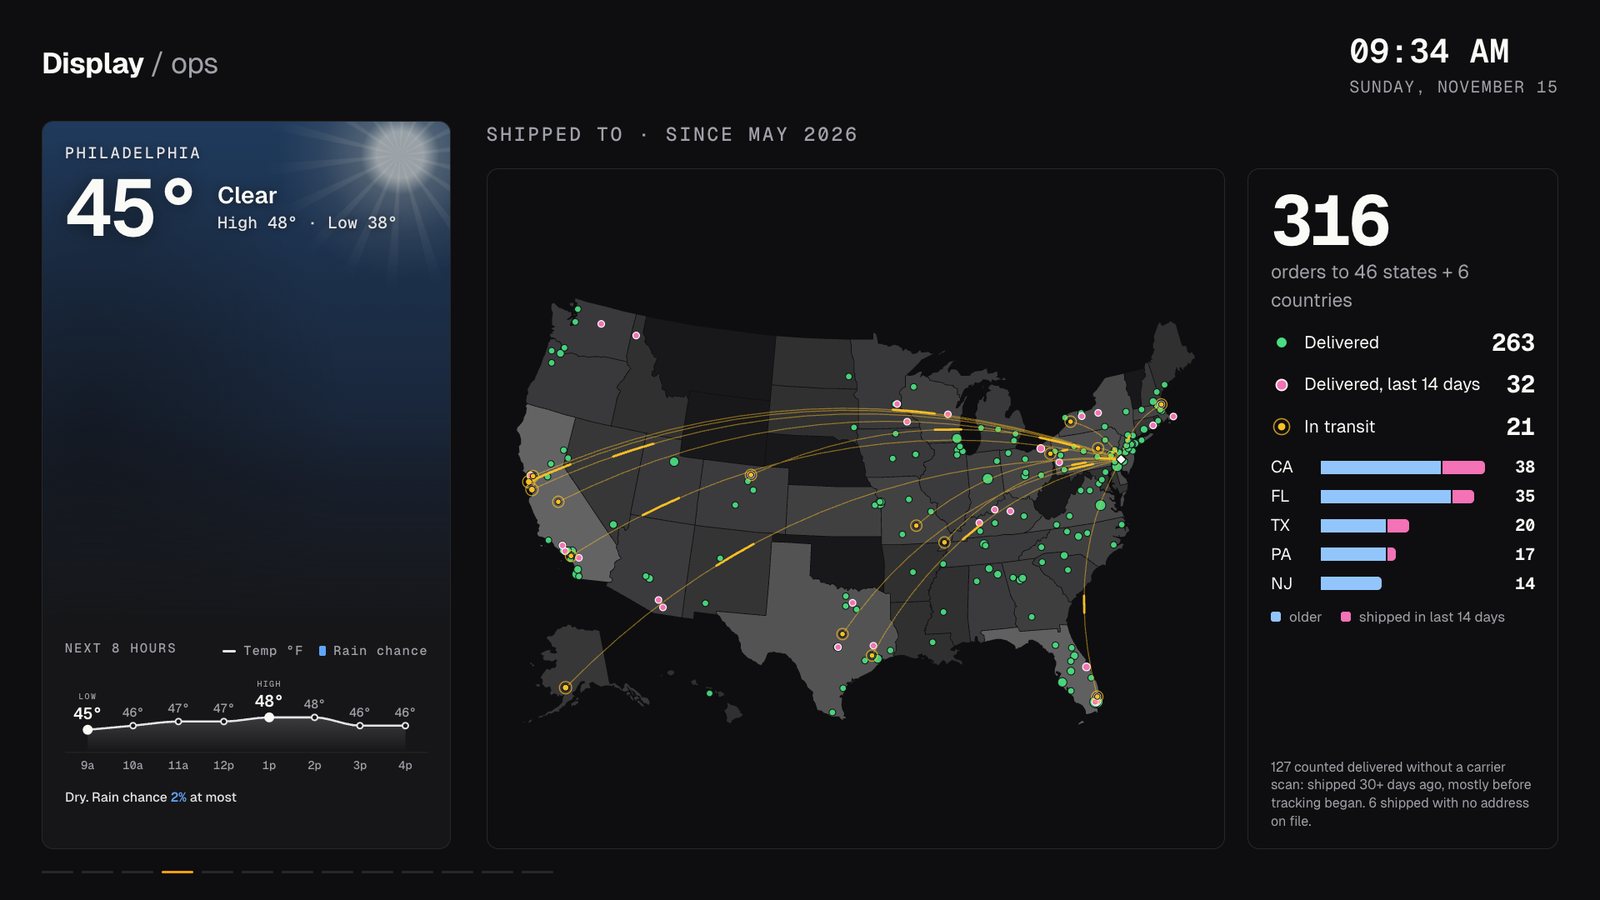
One more map scene is worth showing, with the details taken off. It draws every shipment’s destination since May 2026 on a US map: states shaded by volume, a dot per destination, and an arc from the shop for each parcel still in transit. As of 2026-11-15 the totals on it read 316 orders to 46 states and 6 countries. For this post I rendered it from the real data with the origin moved to city centre, every dot rounded to about 11 km, and the per-shipment city list removed. No street-level detail is on the page at all.
Fonts and transitions
All three faces are vendored: Geist for body text, Geist Mono for the instrument voice, and Fraunces for headlines only. They are OFL-licensed woff2 files shipped with the page, so a panel never reaches for a CDN. The page asks for the exact weights up front and waits for them, because the scenes measure their text to fit, and measuring before the fonts load gives wrong widths.
Slide changes are transitions, not cuts. They run inside the browser’s View Transitions API, and one of three recipes joins old and new: an iris that opens from a focal point, a dive through it, or a WebGL morph where the old slide breaks into points sampled from its own boxes, text and photos, then re-forms as the next. The recipe is chosen from the two scene ids alone, so every panel plays the same one. Map to map is always the morph, and text slides never are. The morph first froze the page for 80 to 500 ms on a 7760 with a 4K panel, because it was re-walking long map paths for every point. After fixing that and compiling the shaders ahead of time it samples a slide in under 0.1 s. Reduced motion, no WebGL2, a lost context or a run of slow frames all fall back, morph to iris and iris to a plain change, and a slow run halves the point count first.
What broke
| When | What | How I found it |
|---|---|---|
| 2026-09-02 | Every panel went black after 10 minutes. The board process was running happily. The power policy blanks idle screens, which is right for a desktop and fatal for a wall board that never gets input. | Only by screenshotting a real panel. Nothing in the service state showed it. |
| 2026-09-03 | Panels drifted out of step, because rotation started from each Chrome’s launch time. | I measured clock sync first and was wrong about the cause. See above. |
| 2026-09-04 | A deploy landed a new page on disk and the screen kept running the old one. One panel was executing a page more than 24 hours old after a successful deploy. | A scene I had just added was missing from the wall but present on my laptop. Chrome parses the page once at start, and the playbook only restarted it when the systemd unit changed. |
| 2026-09-16 | On a desk, the board never appeared. Wrapping the kiosk in an idle inhibitor, which is right for a wall, suppressed the idle watch on a desk. | I measured it: with the inhibitor held, a watch armed at 5 s had not fired after 201 s. With the inhibitor gone it fired in 5. |
| early | The first radar basemap served a watermark with a 200 OK. | Looking at the pixels. |
| first rollout | A weather API rate-limited eight machines asking at once and flashed a full-screen “unavailable” card. | A transient miss now omits the section instead of reporting an error. |
The pattern is the same in four of them. Every signal I could query was green: the service was active, the file was present, the page rendered, the data was fresh. What was wrong was the pixels on a screen. I now have a script that takes a screenshot of a real panel, and I trust it over any status page.
One thing I removed for taste. For a while the whole stage drifted by a few pixels on a slow loop to spread wear. Scenes change every 34 seconds, which already varies every pixel, so the drift bought nothing and made content look like it was wobbling. It is gone. The periodic rest to black and the dark ground stay.
Seeing it from elsewhere
There is also a browser view for me. It serves one panel’s own board directory read-only, behind my login, and wraps the page in a frame that scales the 1920 by 1080 layout to any window. It shows exactly what that panel shows, and it is down when that panel is down, which I accept.
What I would do differently
- Write the screenshot script first. Four of the six failures would have been caught on day one.
- Put the page-version in a visible corner. “Deployed” and “running” were never the same statement.
- Test the headline filter against a week of saved feeds before turning it on. A filter that hides a story is invisible by design.
The whole thing is 96 commits over about two and a half months, and many of the recent ones are about fitting text into boxes. A wall is only useful if people can read it from across the room. Everything else is plumbing.